Mara Beck · 20 October 2026
Farlow's Traffic Data Sparks Fresh Approaches to Linking Safety Upgrades with Neighborhood Growth Patterns
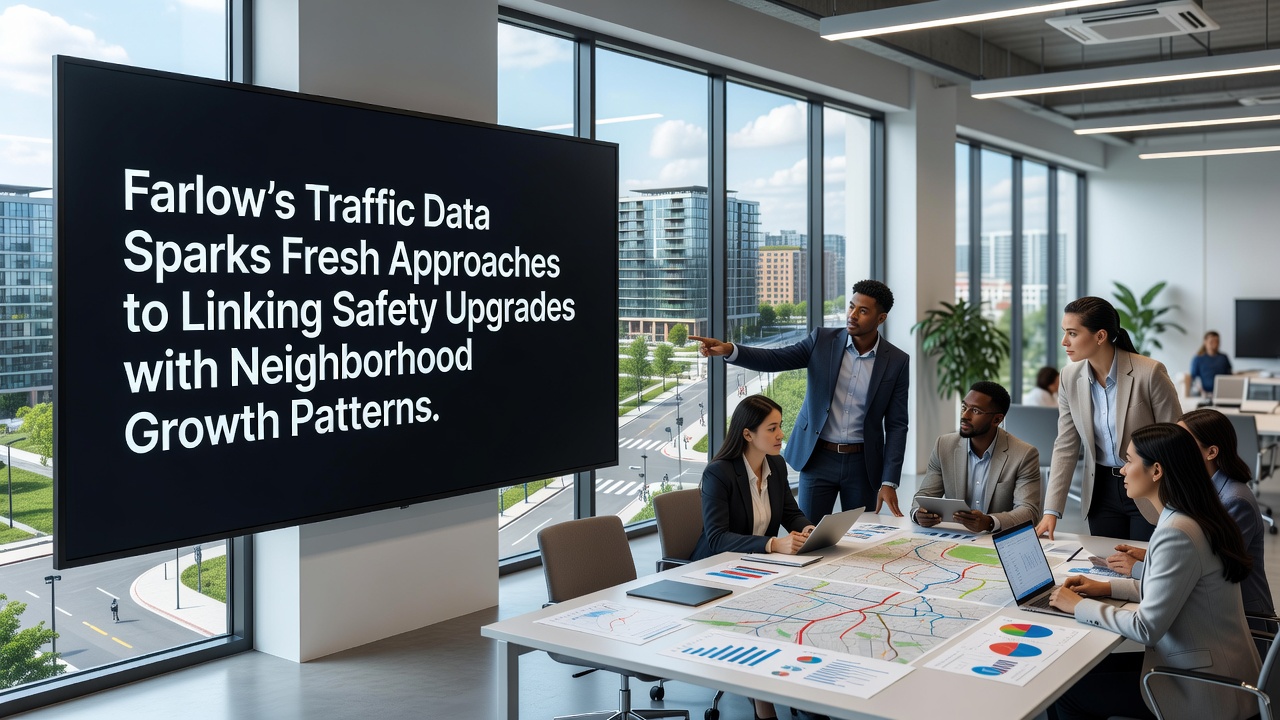
Farlow's traffic monitoring systems have collected detailed datasets over recent years that now inform connections between road safety improvements and local development trends. Sensors installed along major corridors track vehicle volumes, speeds, and incident locations while city planners cross-reference those figures with housing permits and commercial zoning changes. This integration reveals how safety modifications align with population shifts in specific districts.
Data Collection Methods and Initial Findings
Traffic analysts in Farlow deployed continuous count stations at 47 intersections beginning in 2022, and the resulting records show average daily traffic increases of 18 percent in expanding residential zones between 2023 and 2025. Pedestrian counts at those same locations rose 24 percent during the same period according to automated camera logs. City engineers then mapped these numbers against building permit records that document 1,240 new residential units approved through mid-2026.
Researchers at the local planning department combined the datasets using geographic information systems, and the merged maps highlight clusters where safety upgrades coincide with higher growth rates. One corridor in the eastern sector recorded a 31 percent drop in collision rates after signal timing adjustments and added crosswalks were completed in 2024, while adjacent neighborhoods saw new apartment construction accelerate shortly afterward.
Linking Safety Measures to Growth Patterns
Farlow officials have begun testing predictive models that forecast how proposed safety features might influence future neighborhood expansion. The models incorporate variables such as school enrollment trends, business license applications, and public transit ridership figures collected monthly. Preliminary runs indicate that intersections equipped with protected bike lanes attract 12 percent more foot traffic within six months of installation, a pattern that correlates with nearby retail lease signings.
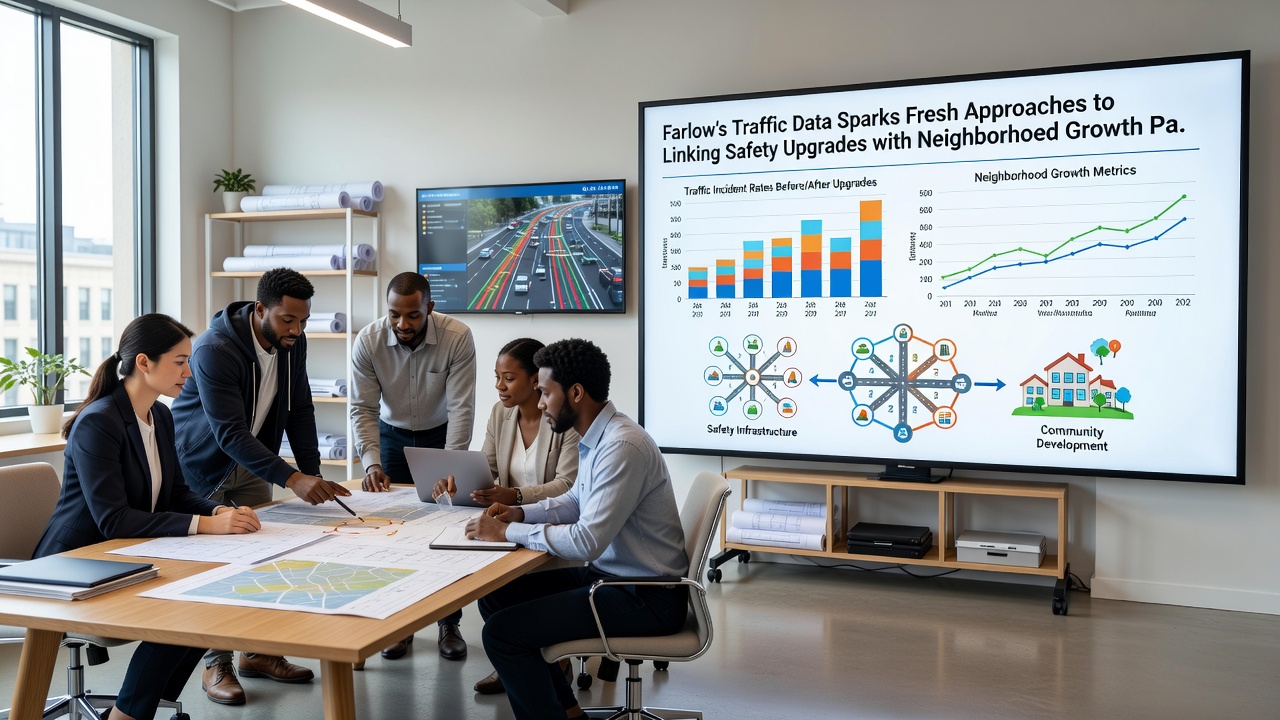
Planners have also examined data from comparable mid-sized communities, and a report from the Federal Highway Administration notes similar correlations in several U.S. cities where targeted infrastructure changes preceded measurable shifts in commercial activity. Farlow's approach adds real-time sensor feedback to those static comparisons, allowing adjustments as construction projects progress through 2026.
October 2026 Planning Session Outcomes
During an October 2026 workshop, city staff presented updated visualizations that overlay traffic crash heat maps with projected housing growth boundaries through 2030. Participants reviewed cases where roundabouts reduced speeds by an average of 9 miles per hour and coincided with a 15 percent rise in nearby property values within two years. Attendees discussed how to prioritize future projects using these combined indicators rather than addressing safety or growth in isolation.
Additional analysis presented at the session drew on European Commission transport studies that document long-term effects of pedestrian priority zones on surrounding land use. Farlow staff adapted several of those methodologies to local conditions, including adjustments for seasonal tourism spikes that affect downtown traffic counts each summer.
Implementation Examples Across Districts
In the northern district, installation of raised crosswalks and LED street lighting in 2023 preceded a surge in mixed-use development applications the following year. Permit data shows eight new projects submitted within 800 meters of the upgraded intersections, compared with three submissions in the prior 12-month period. Traffic volume at those sites stabilized rather than increased despite the added density, a result attributed to the calming measures.
Southern corridor upgrades followed a different sequence, with growth pressures prompting safety reviews before construction began. Here, data indicated that adding bus pullouts and sidewalk extensions reduced vehicle-pedestrian conflicts by 27 percent while supporting higher transit usage that aligned with new office space leasing activity. City records confirm the pattern held through the first three quarters of 2026.
Conclusion
Farlow continues to refine its data integration processes as additional sensors come online and development applications accumulate. The combined approach supplies planners with measurable links between safety interventions and neighborhood trajectories, supporting decisions that account for both current conditions and anticipated changes. Ongoing monitoring will track whether these methods sustain the observed alignments through subsequent reporting cycles.